1 Introduction
This technical note describes an summarizes performance tests with PPDB prototype. Performance of PPDB operations is crucial for Alert Production (AP) as it has to fetch and save large number of records in PPDB.
2 AP Prototype
Alert Production prototype is an application that simulates AP pipeline and uses PPDB interface to fetch/store DIA objects and sources. Initially PPDB implementation was developed as part of this prototype in l1dbproto package. As implementation matured it has been moved to dax_ppdb package which is also used now by AP group for pipeline implementation.
Prototype application (ap_proto) contains mock implementation of Difference
Image Analysis which is based on pre-defined position of a variable objects.
The average density of the variable objects is defined so that it produces
about 10,000 sources per visit. On top of that mock DIA adds additional 50%
random sources representing noise. Mock DIA does not generate any physical
quantities for the sources except their positions. ap_proto mocks matching
of DIA sources to existing objects using its knowledge of the source origin
thus avoiding position-based match. This likely works more perfectly than
actual matching in real AP pipeline, but it should be sufficient for
purpose of this prototype. Overall AP pipeline simulation in prototype runs
extremely fast but its output is not usable for anything except performance
studies.
PPDB implementation that was developed as part of the prototype and currently
existing in dax_ppdb is specially instrumented to produce logging
records which include timing information for individual PPDB operations.
ap_proto adds more timing information to the logging output. Separate
script is used to analyze log files produced by prototype and generate summary
CSV file with per-visit timing information which is later analyzed in Jupyter.
To simulate concurrency aspect of AP pipeline ap_proto splits circular
FOV region into a number of square tiles (e.g. 15 by 15) and processed
these tiles concurrently. Two different approaches were used for tile
processing:
- fork mode: after DIA mock stage script forks itself into the number of sub-processes, one sub-process per tile, and all of them run concurrently on the same host (this is repeated on every visit).
- MPI mode: it starts one process per tile on MPI cluster, one process is responsible for DIA mock stage which then distributes generated sources to all other processes, each running on data from its separate tile.
Obvious drawback of the fork mode is a competition for CPU resources on single host with typical number of tiles much larger than number of cores even on relatively large hosts, though tests show that this is not an issue due to a bottleneck on database server side. MPI mode should produce more faithful simulation of actual pipeline running if there is a sufficient number of hosts to run all processes.
3 PPDB Schema
Database schema used in prototype is the baseline schema defined in DPDD and cat package with some modifications:
- DIAObject table adds few columns that are used by the prototype or AP pipeline (these columns will probably be added to official schema).
- Additional tables could be used by PPDB implementation to optimize access to most frequently used data (effectively de-normalization of standard schema), these tables are internal to implementation and do not change client-visible schema.
As mentioned above, prototype does not generate sensible science data for the bulk of the columns, only spatial information and Object/Source relations are are filled by prototype.
4 Hardware Description
Different storage backends were tested on different platforms and different location, this was driven by hardware and backend availability at a time.
Initial testing and development was performed on a single host at IN2P3 which allowed us to compare SSD and spinning disk-based storage options for database, with MySQL or PostgreSQL used as backend. Both clients and server were running on the same host (for the lack of other comparable hardware). Machine specifications are:
- CPU: Intel(R) Xeon(R) CPU E5-2680 v4 @ 2.40GHz
- 2x14 physical cores, 56 total threads
- 512GB RAM
- SSD storage: 2TB NVMe and 3TB SATA
- spinning disks: 7.3TB in RAID6 array
In second series of tests with Oracle RAC at NCSA database server ran on 3 identical hosts (details are in NCSA RAC):
- Dual Intel Xeon E5-2650 @ 2.00GHz
- 2x8 physical cores, 32 total threads
- 128GB RAM
- storage: NetApp array with 50x8TB HDDs, 10x1.5TB SSDs (RAID1 array), connected via 16Gbps Fibre Channel
Tests with PostgreSQL server on Google Cloud platform were using virtual Compute Engine, two hosts were set up, one for database server, another for clients. Specs for both hosts are:
- Server host:
- 64 vCPU (Intel Sandy Bridge)
- 416GB RAM
- storage: 10TB SSD (network-connected)
- Client host:
- 64 vCPU (Intel Sandy Bridge)
- 57GB RAM
5 Individual Tests
5.1 MySQL and PostgreSQL at IN2P3
5.1.1 Single-process tests with HDD
This testing was mostly a part of a development process for initial version of PPDB implementation using baseline schema without big optimizations. Ticket DM-6370 contains lots of details of this initial testing which was done with spinning disks. Tests ran in single-process mode, without splitting FOV into multiple tiles, all processing happened in the same client process.
It quickly became clear that spinning disks do not provide sufficient
performance for PPDB access pattern due to high latency. Modifying primary key
definition of the DIAObject table with MySQL/InnoDB backend improved data
locality and selection performance for that table. Baseline schema defines PK
for DIAObject table as (diaObjectId, validityStart), modified PK adds
new leading column (htm20, diaObjectId, validityStart).
MySQL/InnoDB stores data together with PK, having spatial column as first PK
column leads to better data locality. This change has no effect on data
locality for PostgreSQL.
Even after this modification both MySQL and PostgreSQL performance on spinning disks was inadequate. Even for relatively small number of visits around 5,000 time to read data from DIAObject table for single visit was at the level of 20 seconds (DIASources were not even read from database in the first series of tests), time to store all records from one visit is at the level of 100 seconds. It is obvious that concurrency is not going to improve situation drastically due to the IOPS limitation of spinning disks.
5.1.2 Single-process tests with SSD
For next series of tests SSD-based storage was used, with either SATA or NVMe disks, ticket DM-8966 covers those tests. Quick summary of these test:
- Performance is drastically better than with spinning disks.
- SATA and NVMe disks show very similar performance numbers.
- MySQL and PostgreSQL numbers also look very similar.
- Time to read or write data grows approximately linearly with the number of visits and amount of data in database.
- Typical numbers for 15k visits is 10 seconds for select (which now includes reading of sources in addition to objects) and about 15 seconds for inserts, MySQL performance is slightly worse for inserts.
- Largest contribution to select time is due to DIAObject select,
Ticket DM-8965 tried to improve timing for DIAObject operations by de-normalizing that table into two separate tables. Baseline schema for DIAObject has begin/end times for validity interval, and intervals should cover whole range without gaps, so that begin time of one record is always an end time for some other record with the same object ID. AP pipeline only reads latest version of each DIAObject (with validity end time at +Infinity), and keeping spatial index of all interval is unnecessary overhead. Keeping latest version of each DIAObject in a separate table with spatial index we can speed up both select time (by reducing number of object in spacial index) and insert time (by excluding spatial column from PK for all intervals and not updating validity end time).
Extended schema for DIAObject now consists of two tables:
DIAObjecttable with the same columns and indices as in baseline, except thatvalidityEndcolumn is not filled (it should be dropped from schema entirely),DIAObjectLasttable with same columns as inDIAObjecttable, this table contains latest version of each DIAObject.
All select operation in AP pipeline select data from DIAObjectLast table,
store operation for new DIAObjects updates both tables. Updates of
DIAObjectLast table can potentially be made faster by updating records in
place, but that would require relaxing transaction isolation and may not be
supported by some backends.
With this updated schema select of DIAObject runs twice as fast compared to
previous tests. MySQL also showed better insert performance when using REPLACE
query instead of REMOVE+INSERT for DIAObjectLast. PostgreSQL insert
performance for two tables was slightly worse than insert into single table,
in-place update (UPSERT) was not implemented for PostgreSQL in this test.
5.1.3 Multi-process tests with SSD
Ticket DM-9301 runs tests on the same platform but in multi-process setup
splitting FOV region into square tiles with either 5x5 or 15x15 split. Each
tile is processed in a separate process and all of them run concurrently.
Fork mode is used in this case, with server and all client processes running
on the same machine. Same DIAObjectLast table was used for optimization
of DIAObject access.
Summary of findings for this series of tests:
- multi-process setup runs significantly faster than single-process
- 15x15 tiling runs faster than 5x5
- PostgreSQL performs better than MySQL
- with PostgreSQL performance of NVMe storage is better than SATA
Figure 1 shows wall clock time per visit as a function of visit number for 15x15 tiling with PostgreSQL and NVMe storage. Note that on this and other plots boxes and whiskers signify quartiles, not RMS; and whiskers cover range of all observed values. Small red dots show average value.
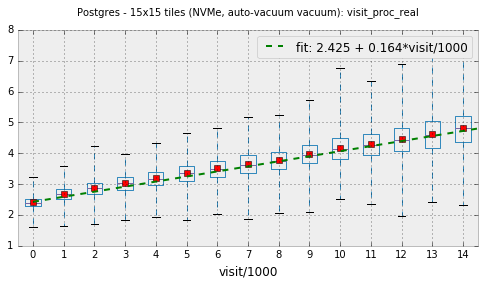
Figure 1 Real time per visit as a function of visit number.
5.1.4 Summary of the results from IN2P3
The results of all above tests could be summarized as:
- Spinning disk storage performance is clearly inadequate for PPDB.
- SSD storage shows promising results at relatively low number of visits with concurrent tile/CCD processing.
- Processing time shows approximately linear dependency on the size of the data in database and number of visits.
- Further studies with larger data volumes are clearly needed to understand scaling behavior.
5.2 Oracle RAC at NCSA
Next round of tests was performed at NCSA with a newly-provisioned Oracle RAC system. Prototype code needed to be adapted for Oracle to use most efficient constructs that are backend-specific.
5.2.1 Initial tests
Ticket DM-14712 provides a long story of the attempt to understand and control Oracle behavior with PPDB. Some notable updates to implementation that were implemented for Oracle are:
DIAObjectLasttable is created as Index-Organized Table (IOT) to reduce additional access to heap data.- This also required reduction of the width of the table as IOT performance with wide table was unacceptable, leaving nly about 15 columns in that table that are needed by AP pipeline helped to improve performance.
Cluster storage included both spinning disks and SSD, for initial testing I tried to compare SSD and spinning disk performance but results were inconclusive, performance with HDD was not much worse than with SSD, this could be due to large in-memory cache of the array controller.
A lot of time and effort was spent trying to understand significant performance drop observed for small data size (low visit count). The effect was seen as quickly growing processing time for visit which then quickly dropped to a reasonable numbers. Figure 2 show this behavior.
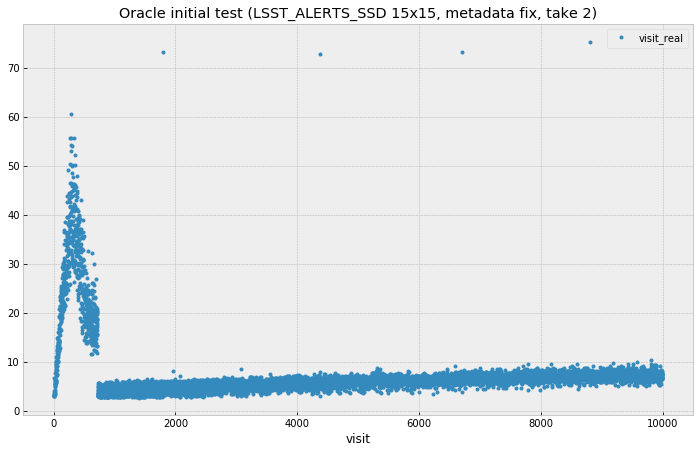
Figure 2 Plot illustrating Oracle performance degradation at low visit numbers.
Database administrator explained that this unfortunate behavior could be remedied by pre-loading table statistics that is needed for optimizer, but that statistics need to be obtained first from running on a larger volumes of data. Several attempt to find workarounds based on query hints were unsuccessful.
Summary from these initial tests (copied from JIRA ticket):
- With freshly initialized schema optimizer prefers (FAST) FULL INDEX SCAN which is significantly worse than INDEX RANGE SCAN plan.
- It looks like optimizer needs to have significant volume of data in a table before it switches to a more efficient plan, I estimate some thing like 10-20 million rows.
- I think stats collection has to be enabled for that too.
- We failed to find a way to force Oracle to lock into a better plan using query hints.
- IOT works reasonably well if table has small number of columns, I think this is what we want for production.
5.2.2 Testing multi-node clients
Pervious tests were running prototype in a fork mode using single host on LSST verification cluster. One machine with relatively large number of cores can reasonably handle CPU load from 255 forked processes, but fork mode has one significant drawback in that it needs to open new database connection in each forked process. More efficient approach would be to have per-CCD processes always running and always connected to the database eliminating overhead of making new database connections. This approach was implemented in the new series of Oracle tests using MPI for inter-process communication. MPI also allowed us to use more than one node on client side which eliminates potential client-side bottleneck from non-shared memory.
Ticket DM-16404 describes the results of running Oracle tests using MPI mode with AP prototype running on several machines from LSST verification cluster. To estimate the effect of permanent database connections test was initially configured to close and re-establish connection on every visit but later was switched to permanent connection mode. Figure 3 shows the effect of that switch, per-visit processing time was reduced by about 2 seconds. Figure 4 shows the fit of the data in the region with permanent connections.
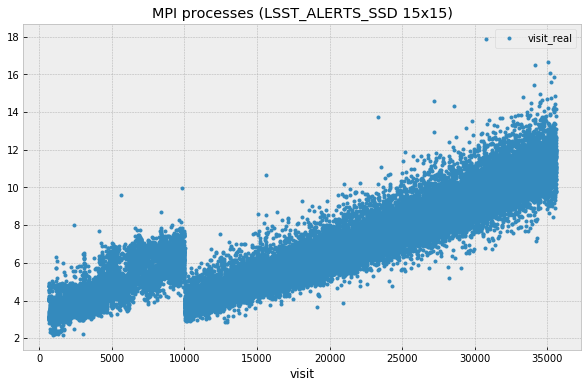
Figure 3 Plot illustrating the effect of keeping database connection, after visit 10,000 connections were made permanent. This plot excludes initial region with poor performance.
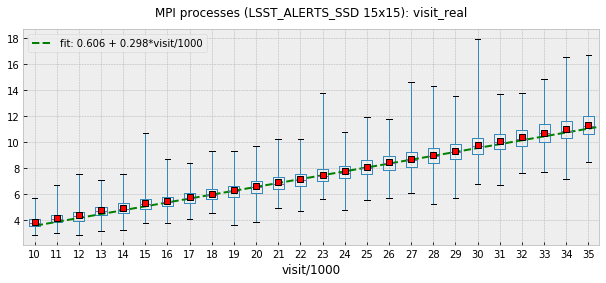
Figure 4 Fit of the above scatter plot for visits above 10,000.
In addition to total per-visit time collected statistics included time per individual types of database query, e.g. selecting or saving DIAObjects. Comparing visit dependency of these times shows that fastest growing value is the time to select DIASource history, followed closely by time to select DIAForcedSource history. Both timings show approximately linear growth with the number of visits. Figure 5 shows these dependencies. Scaling these two queries to 12 months as required by AP pipeline is probably a most significant problem in PPDB. Figure 6 shows insert time as a function of visit number. Full time (marked as “store_real” on plot) shows linear dependency and is significantly lower than select time. Total time is dominated by insert time for DIAObject, that time is much higher than insert time for DAISource and DIAForcedSource, this is due to more complex indices needed for DIAObject.
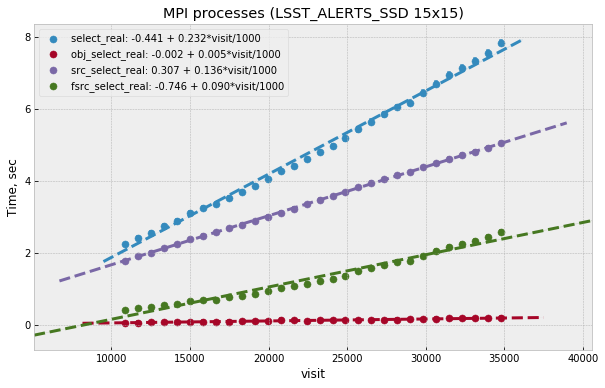
Figure 5 Time for different select queries as function of visit number. Top line is a combined sum of three other contributions.

Figure 6 Time for different insert queries as function of visit number. Top line is a combined sum of all individual contributions.
Figure 7 shows fraction of the visits with total visit time higher than 10 seconds as a function of visit number. This plot is for illustration only, it is difficult to interpret its behavior without understanding many details of prototype or its execution environment.
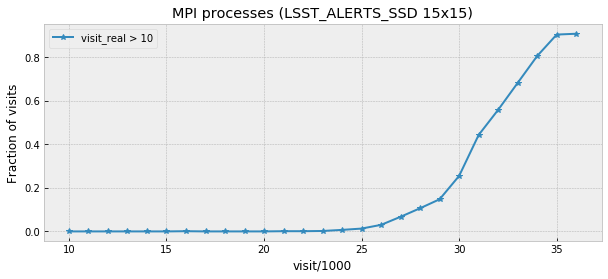
Figure 7 Fraction of visits with total total visit time higher than 10 seconds.
5.2.3 Summary of Oracle tests
In general performance of Oracle server is comparable with the numbers from PostgreSQL test in the region where they overlap (below 15 visits) even though those numbers were obtained in very different hardware setup. Fit of the data shows that Oracle performance drops somewhat faster with the number of visits. At 30k visits prototype spends about 10 seconds on data persistency which could still be reasonable for AP pipeline. With linear behavior it is clear that we need some different approach to scale this beyond one month of data.
The issue with quick initial performance drop for Oracle has not been understood or satisfactory resolved, requiring additional step to collect statistics and pre-load it may be a significant drawback for production activities.
5.3 PostgreSQL at Google Cloud
To study longer periods than it was possible at IN2P3 PostgreSQL tests were repeated on Google Cloud platform. Ticket DM-17654 describes results obtained in that test. Google Cloud provides reasonable options for CPU and memory ranges, SSD storage is available in significant volumes but it is network-attached and shared which impacts performance. Google documents their SSD performance at the level of 60k IOPS for reading and 30k IOPS for writing (Gcloud SSD performance) which is lower than can be achieved with locally-attached NVMe storage.
This series of tests ran in a fork mode on a single client machine with 64 cores. Quick test was done with MPI mode with all client running on the same host but its performance was worse than fork mode. No attempt was done to run MPI tests on multiple client hosts, with the main bottleneck being on server side it likely will not show any improvement (though connection reuse can bring small improvement as was seen in Oracle tests).
These tests were running for longer period, in total 57k visits were generated. Performance seen in these tests is comparable to Oracle, with somewhat improved reading performance and somewhat worse writing performance (latter can probably be explained by storage IOPS limitation). Reading times still increase approximately linearly with the number of visits. Figure 8 shows visit dependency for all select queries. Largest contribution as before comes from reading DIASource history. Figure 9 shows insert times as a function of visit. These times are approximately 4 times higher compared to Oracle case and they are comparable to select times. Total insert time is similarly dominated by DIAObject insert time and their visit dependency is not linear any more. DIAObject insert time appears to be proportional to the total number of DIAObjects inserted, growth slows after approximately 24k visits as the forced photometry has a cutoff time of 30 days for noise sources. This lower performance of inserts could be explained by limited IOPS that are inherent to network-attached storage.
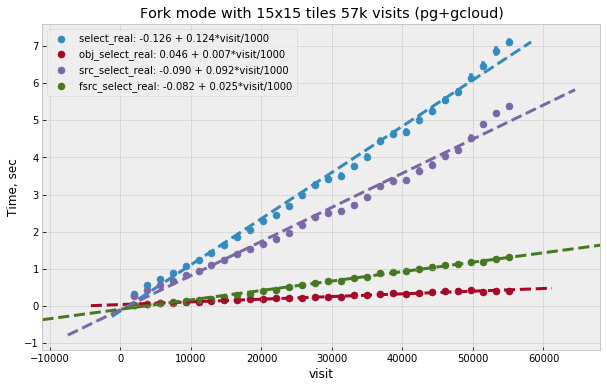
Figure 8 Time for different select queries as function of visit number
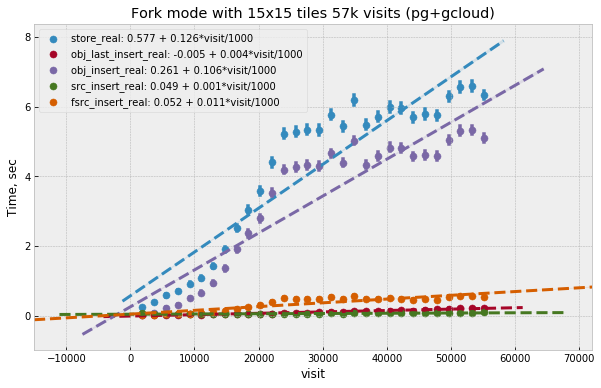
Figure 9 Time for different insert queries as function of visit number
Figure 10 shows fraction of the visits with total visit time higher than 10 seconds as a function of visit number. Same caveat applies to this plot as to corresponding Oracle plot.

Figure 10 Fraction of visits with total total visit time higher than 10 seconds.
Table 1 details disk space used by individual tables and their corresponding indices after 57k visits.
| table_name | row_estimate | total | index | table |
|---|---|---|---|---|
| DiaObject | 3.82072e+09 | 3003 GB | 352 GB | 2651 GB |
| DiaSource | 8.59906e+08 | 847 GB | 118 GB | 729 GB |
| DiaForcedSource | 3.82071e+09 | 548 GB | 248 GB | 301 GB |
| DiaObjectLast | 3.14808e+08 | 86 GB | 29 GB | 58 GB |
| Totals | 4484 GB | 747 GB | 3739 GB |
6 Test Summary
Main conclusion from tests performed so far is that performance may be reasonable for one or two months of data with data stored on SSD but performance drops linearly with the number of visits. Largest contribution to this slowdown comes from reading the history of DIASource, improvements have to be made for this table and DIAForcedSource if we are to scale it to full 12 months of history.
Reading speed can be improved if we can keep their data in memory, e.g. in-memory tables or memory-based filesystem. Storing all 12 months of data in memory for these tables is not feasible at this point for a single host. Potentially memory storage could only keep data for next few visits (if visit pointing is predictable) but pre-fetching of that data will very likely interfere with other database and I/O activities on the same host.
It is likely that the only solution for this problem is a scalable distributed data store with multiple servers and significant parallelism. The technology for that backend does not have to support relational model directly as long as it maps reasonable to PPDB data model and provides data safety guarantees. Potential options can include in-memory stores with disk persistence or SSD-based storage with in-memory cache and pre-fetch options. With any solution replication and high availability would be required to avoid disruptions during critical periods.